Interview by Charlotte Kent
Domestic Data Streamers was founded in Barcelona, Spain, but with projects across 22 countries, the design firm is transforming how people think about data in a digitised world. They build participatory projects by combining designers, social scientists, engineers and creative technologists to research and develop data-based stories.
Pau García is the Founder of Domestic Data Streamers (DDS), but his background working with memory and imagination at the REcall European Conflict Archeological Landscape Reappropriation in Germany and Norway contributed to the core ideas at DDS. In 2013, he received the M4M European Prize. Marta Handenawer, the Creative Director at Domestic Data Streamers, was a designer and engineer who discovered research could provide new insights into analysis and innovation. Together, they aim to show how data produces the world that is more complex and bewildering.
Numbers are used to explaining everything from politics to social dynamics, environment to entertainment, and education to healthcare. But numbers don’t mean anything until we understand how to care about them. Understanding how those numbers came to be can help us make choices to change them.
Their previous exhibitions have been on the impact of video games in society (Homo Ludens) or the scarcity of water (Blue Gold exhibition). In 2021, they developed 730 hours of Violence, expanding awareness of the varieties of violence that are pervasive but often ignored. Crucial to that is recognising how to care about the origins and impact of the experience of violence.
What made you start thinking about empathy?
Pau García: Today, we live in the era of connection, but people feel more disconnected than ever before. The realities and problems we face today are so big and complex that it is complicated to understand them without numbers. At the same time, reducing these problems to numbers makes societies numb to them. A clear example of this can be seen in the global North with the refugee crisis or the days after COP26 with Climate Change.
There is a quote from Gus Speth, Administrator of the United Nations Sustainable Development Group, that I love he says: I used to think the top environmental problems were biodiversity loss, ecosystem collapse and climate change. I thought that with 30 years of good science we could address those problems. But I was wrong. The top environmental problems are selfishness, greed and apathy… …and to deal with those we need a spiritual and cultural transformation. – and we scientists don’t know how to do that.
We have the technology and the resources to solve most of the problems, but we miss the will to do so. We need specific people, activists, to do that– scientists do something different. To trigger any kind of action, you need people to care about what is necessary for the solution. That starts with empathy.
How does data become a story?
PG: Stories have always used numbers and facts.
Right, I guess even the genealogies of The Bible or the catalog of ships in The Iliad do that.
PG: Maybe not with the amount of data we use in our projects, but for us, there is no difference between a normal story and a data story. You only need to have a more specific focus on the dimension of the problems so people can understand them and compare them to others. Jaime Serra
Was there a statistic or data point that sparked the initial research and investigation that led to 730 hours of Violence?
Marta Handenawer: Steven Pinker, an American cognitive psychologist, stated in his book The Better Angels of Our Nature (2011) that “Humans are less violent than ever”. In an interview, he explained the violence he was observing:
Interviewer: Where did you find evidence for how violence has changed over time?Pinker: For prehistoric times, the main evidence is from forensic archaeology: the proportion of skeletons that had bashed-in skulls, or arrowheads embedded in bones, together with archaeological evidence such as fortifications.
For homicide over the last millennia or so, there are records in many parts of Europe that go back to the Middle Ages. And we know from documents of the era that crucifixions and all manner of gory executions took place in the ancient world.
He describes how governments collected data about war and social violence, which is the main idea that triggered the exhibition. Understanding that what Pinker was measuring was countable, visible violence, but that is only a fraction of the problem as we know it. Authors like Pierre Bourdieu, Judith Butler and Johan Galtung have presented a much more complex view of violence by considering the psychic and social.
Do people ever resist the notion that violence is anything other than physical?
PG: An ancient parable of blind men and an elephant that seems appropriate: A group of blind men heard that a strange animal, called an elephant, had been brought to the town, but none of them knew what that was. So, they sought it out to learn more. The first person, whose hand landed on the trunk, said, “This being is like a thick snake”. Another person reached its ear and described the creature as a fan. When someone touched its leg, the elephant felt like a pillar or a tree trunk.
Regarding the side, someone else said the elephant was a wall. Another, who felt its tail, described it as a rope. The last felt its tusk, which was smooth and curved like a spear.
The instruments and indicators we use to understand the world also have the power to shape it. If we only use the Pinker indicators of violence, we see only a part of the elephant, but it’s dangerous to understand it as a complete truth.
What kinds of violence did you address in 730 hours of Violence?
MH: The exhibition analyses how violence has evolved in recent decades, entering new environments and taking new forms. The exhibition’s starting point characterises violence as an essential part of human history: it changes, transforms, and moves with us.
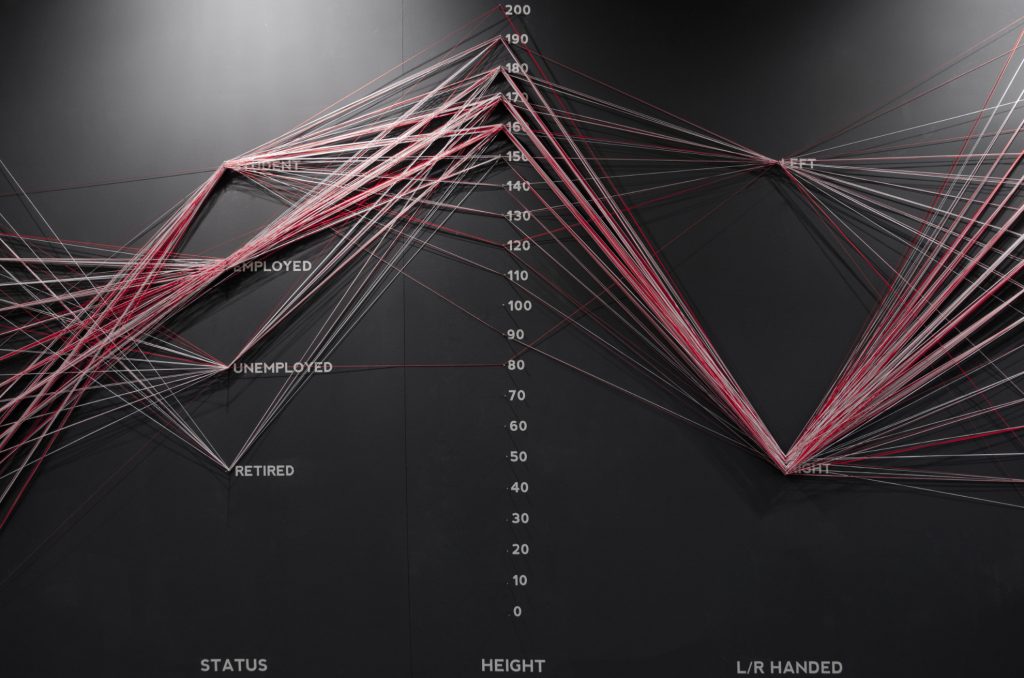
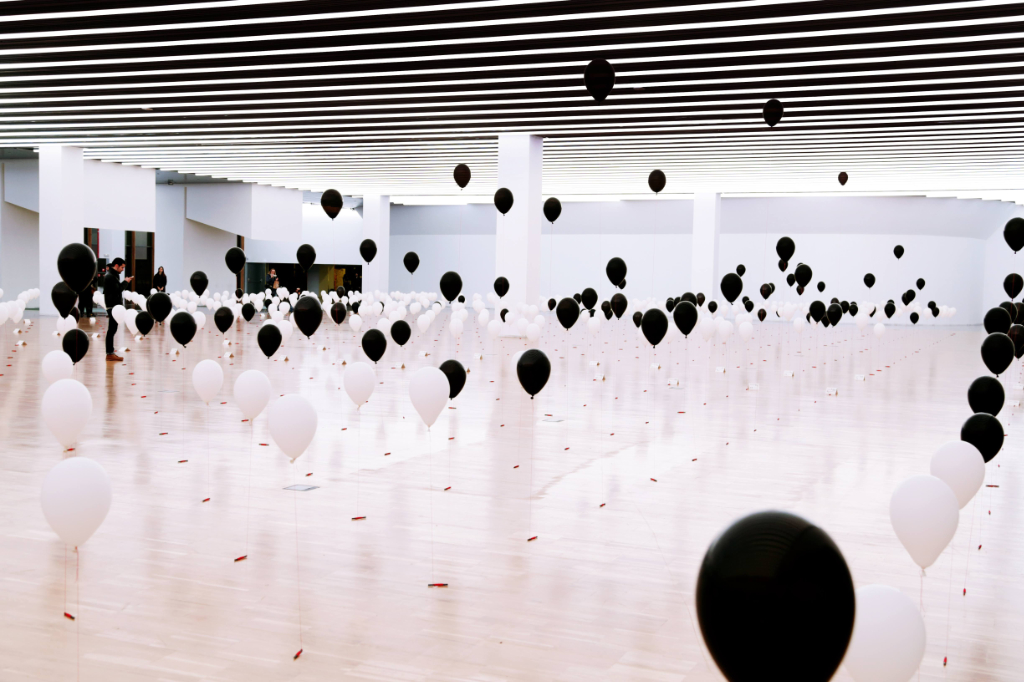
As a result, violence today can be found in new technologies, cities, or economic and social organisation systems. Next, the exhibition focuses on eight contemporary environments where violence silently thrives. In the show, these are organised in two axes: the individual vs the collective and the physical vs the digital space.
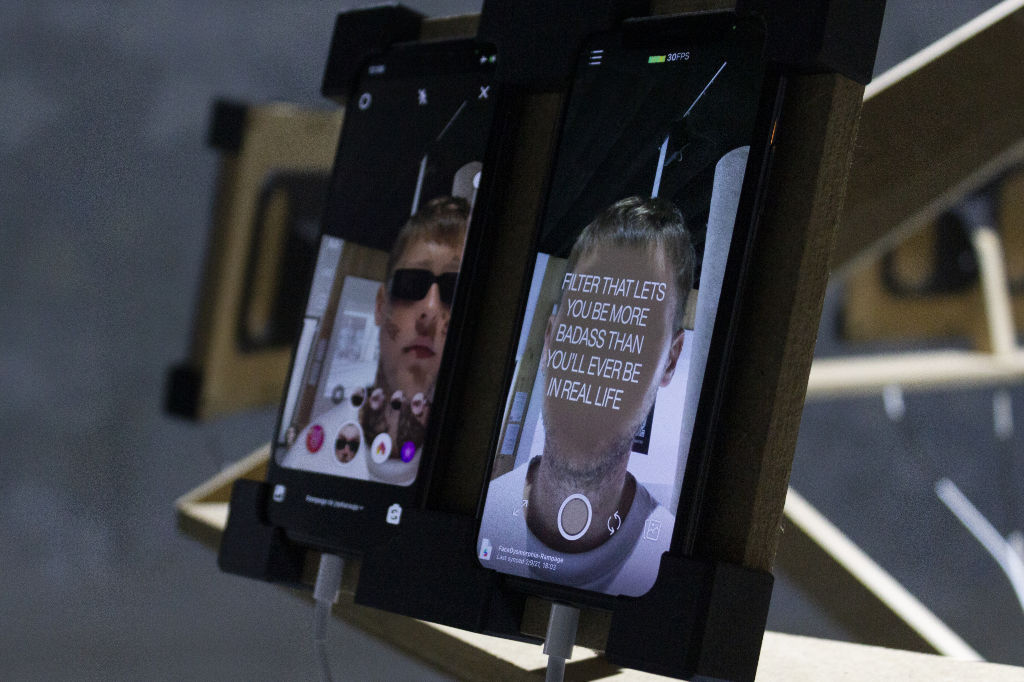
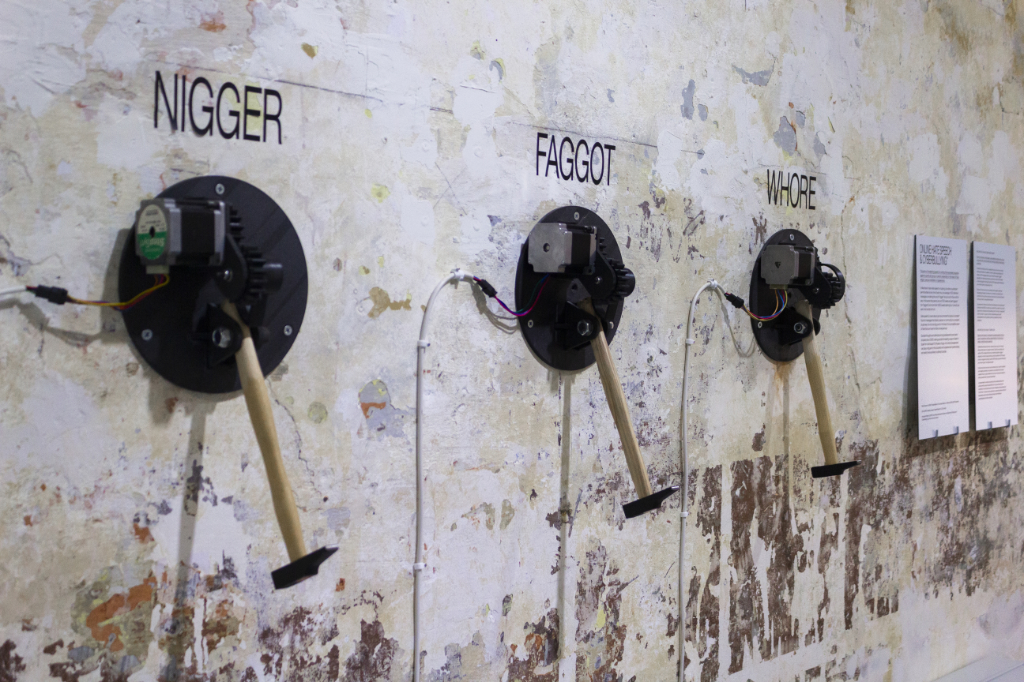
PG: Across those two axes, the final selected forms of violence were: Happy violence, algorithmic violence, glass frontiers, selfie dysmorphia, slow violence, violence by omission, online hate speech and hostile architecture.
Did your research redefine your understanding of violence?
MH: We started this process without knowing where we would end. The idea of focusing on the invisible spectrum of violence happened after months of research on the subject. We understood that the curatorial approach that made the most sense was precisely redefining our understanding of violence—and hoping that the change we’d experience would replicate and resonate with the visitors of the exhibition.
PG: So it did change our perception; the focus moved from the visible and epidemic violence to the structural, subtle and much more extended everyday violence that we all suffer and at the same time are perpetrators and accomplices of it.
It seems as if there are many people and voices involved in Domestic Data Streamers. How did it begin?
PG: I used to paint graffiti; at some point in 2013, with some good friends from the university, we were thinking about making graffiti that could quantify and visualise people’s thoughts in real time. We gathered a team of friends and did our first project in the square of Tres Xemeneies in Barcelona by painting an infographic letting all people who passed by interact and add their opinions.
There, by total serendipity, we were approached by the director of the Contemporary Art Fair in Barcelona, who was walking by. He invited us to exhibit our work at the fair. From there, we started working on one project after another until today.
Nowadays, what kind of specialists or experts do you invite to participate and what indicates to you that they are a good fit for the work DDS does?
MH: The best collaborations, for us, take place when working with people who are passionate about using stories to drive change.
We wanted to include someone in the team who could relate to violence in a more profound sense for this specific project. Therefore, we collaborated conceptually with Sara Torres Rodríguez de Castro, who guided us through the philosophical journey of what violence means and where it can be found. In addition, Sara helped us find authors and advised us through the process of putting into words the challenges we face as a society that is confronting new forms of violence, including but also far beyond what Pinker identifies.
Another person that we got in touch with during the process is David Fernández, a Catalan journalist and activist who is very experienced in civil disobedience. So it’s always a match when we share a purpose.
How do you produce a collaborative working environment? What are the guiding premises that ensure the integrity of the project?
MH: We all participate in the decision-making process of the exhibition, but there’s one person in the team that orchestrates the different elements to ensure coherence. Having a shared vision of what’s expected is important: The DDS team knows that a DDS project always has to have meaningful data, visualisations that can be easily remembered, and thought-provoking questions that someone might want to ask their family/friends while having dinner. Defining these “must-haves” helps us move in a good direction.
How do you make information meaningful? What factors do you take into account as you consider how to design data into visualisations?
MH: We try to be human when working with data. It’s why we often focus on domestic objects and use common visual metaphors to talk about complex concepts and data sets. It’s our duty to help the viewer relate to information better. A big no is an overly complex phrases that might distract someone from understanding our point.
Data can seem very complex, but in the end, it is just an accumulation of human conduct, actions, and patterns. It is our births, deaths, wish lists and bookmarks. Finding the poetry behind the data helps us explain it better.
As a design firm, you have talked about instrumentalising art. How do you balance design elements with artistic license?
PG: The way we approach art is by adopting its language forms. We use sculptures, installations, performances, video art, and other contemporary techniques typically associated with art environments to convey and communicate a message and research. For us, it’s a very subtle line, the one that exists between art and design.
What is the purpose of sharing data as a visual project? How have you seen audiences transformed by seeing the information?
MH: There is a rising trend of explaining the world around us using data (and data only). So we’ve made it our responsibility to rethink data, so that’s told in human and honest ways.
We’ve had amazing experiences in the past eight years while showing data to people: they trigger emotional responses. Once you understand the data, we’ve seen that you can react accordingly. We’ve seen people get angry, cry and laugh in our exhibitions (and I believe this to be a pretty fantastic transformation).
730 hours of Violence represents one month. Why was a month your selected time frame?
MH: We always envisioned this project as a month-long exhibition. In part, because this was an experiment that had to do with the research, curatorship, production, interaction and learning possibilities within the context of an exhibition, and a standard time frame for shows is a month. It was also a set period to get feedback; after 730 hours of people participating and answering the questions posed in the gallery, we analysed them to extract any useful lessons.
Another reason was also to make “730 hours of violence” a scalable and replicable exercise. We could bring the exhibition elsewhere, analyse the responses of a completely different demographic, and compare these with the results we got in Barcelona.
The project is location specific and yet also relevant to all. How did you select local data to contextualise a wider contemporary experience?
MH: We’ve seen that the closer the data is to people, the more meaningful it is for them. So we scour for open reports produced by local councils or institutions and crunch their data to find new meanings and conclusions that can support our findings and storytelling.
Coming back to the analysis you did and the lessons you found that are produced in a report about the impact of the project. What are some key findings?
MH: A few exciting things: even if data from on-demand content platforms such as Netflix tells us that violent content is viral and sought after, when we asked, in the context of the exhibition, “Why do we like violence?” the public made a point by saying they didn’t. Additionally, the top answers were split when answering the question, “when is violence justified?” Self Defense had the highest number of mentions with 27,6% of answers, but it is important to note that Life Protection was a separate category and had 10,6%. No Justification At All got 21,1%.
It’s really important to mention that the visitors to our exhibition felt that they encountered violence at a very young age. They talk about schools, teachers, parents and siblings in the context of their childhood. However, they mostly share that their first experience with violence was as a victim and not as a perpetrator.
What would you hope others would consider about data and the world in which we live after seeing the exhibition?
PG: I believe this exhibition acts as a trigger to challenge people to reframe the concept of violence. We can face realities of violence that have been hyper-normalised. It’s a reminder of how social realities can become dangerously invisible if we don’t point at them and give them a name and acknowledge their impact.
What is your chief enemy of creativity?
Both: Bureaucracy it’s something that kills a lot of projects and ideas at so many levels. Financially because bureaucracy builds high walls for most creative agents, who don’t have the right resources to deal with it. Time-wise, because when you end up spending more time fighting against a bureaucratic machine than doing valuable work, most people abandon ship. Energy-wise, because we all know how bad it feels having to fill up a thousand pieces of paperwork until your skin becomes a bit like the colour of paper.
You couldn’t live without…
Both: Our people. It would be quite a boring place without the family, fools and friends surrounding Domestic Data Streamers. It has been, without doubt, thanks to the much help we have had from lots of friends and family members that we have been able to work, shape, create and build most of our most beloved projects.